Why Now: The Eight-Year Wait for Unified Observability
Table of Contents
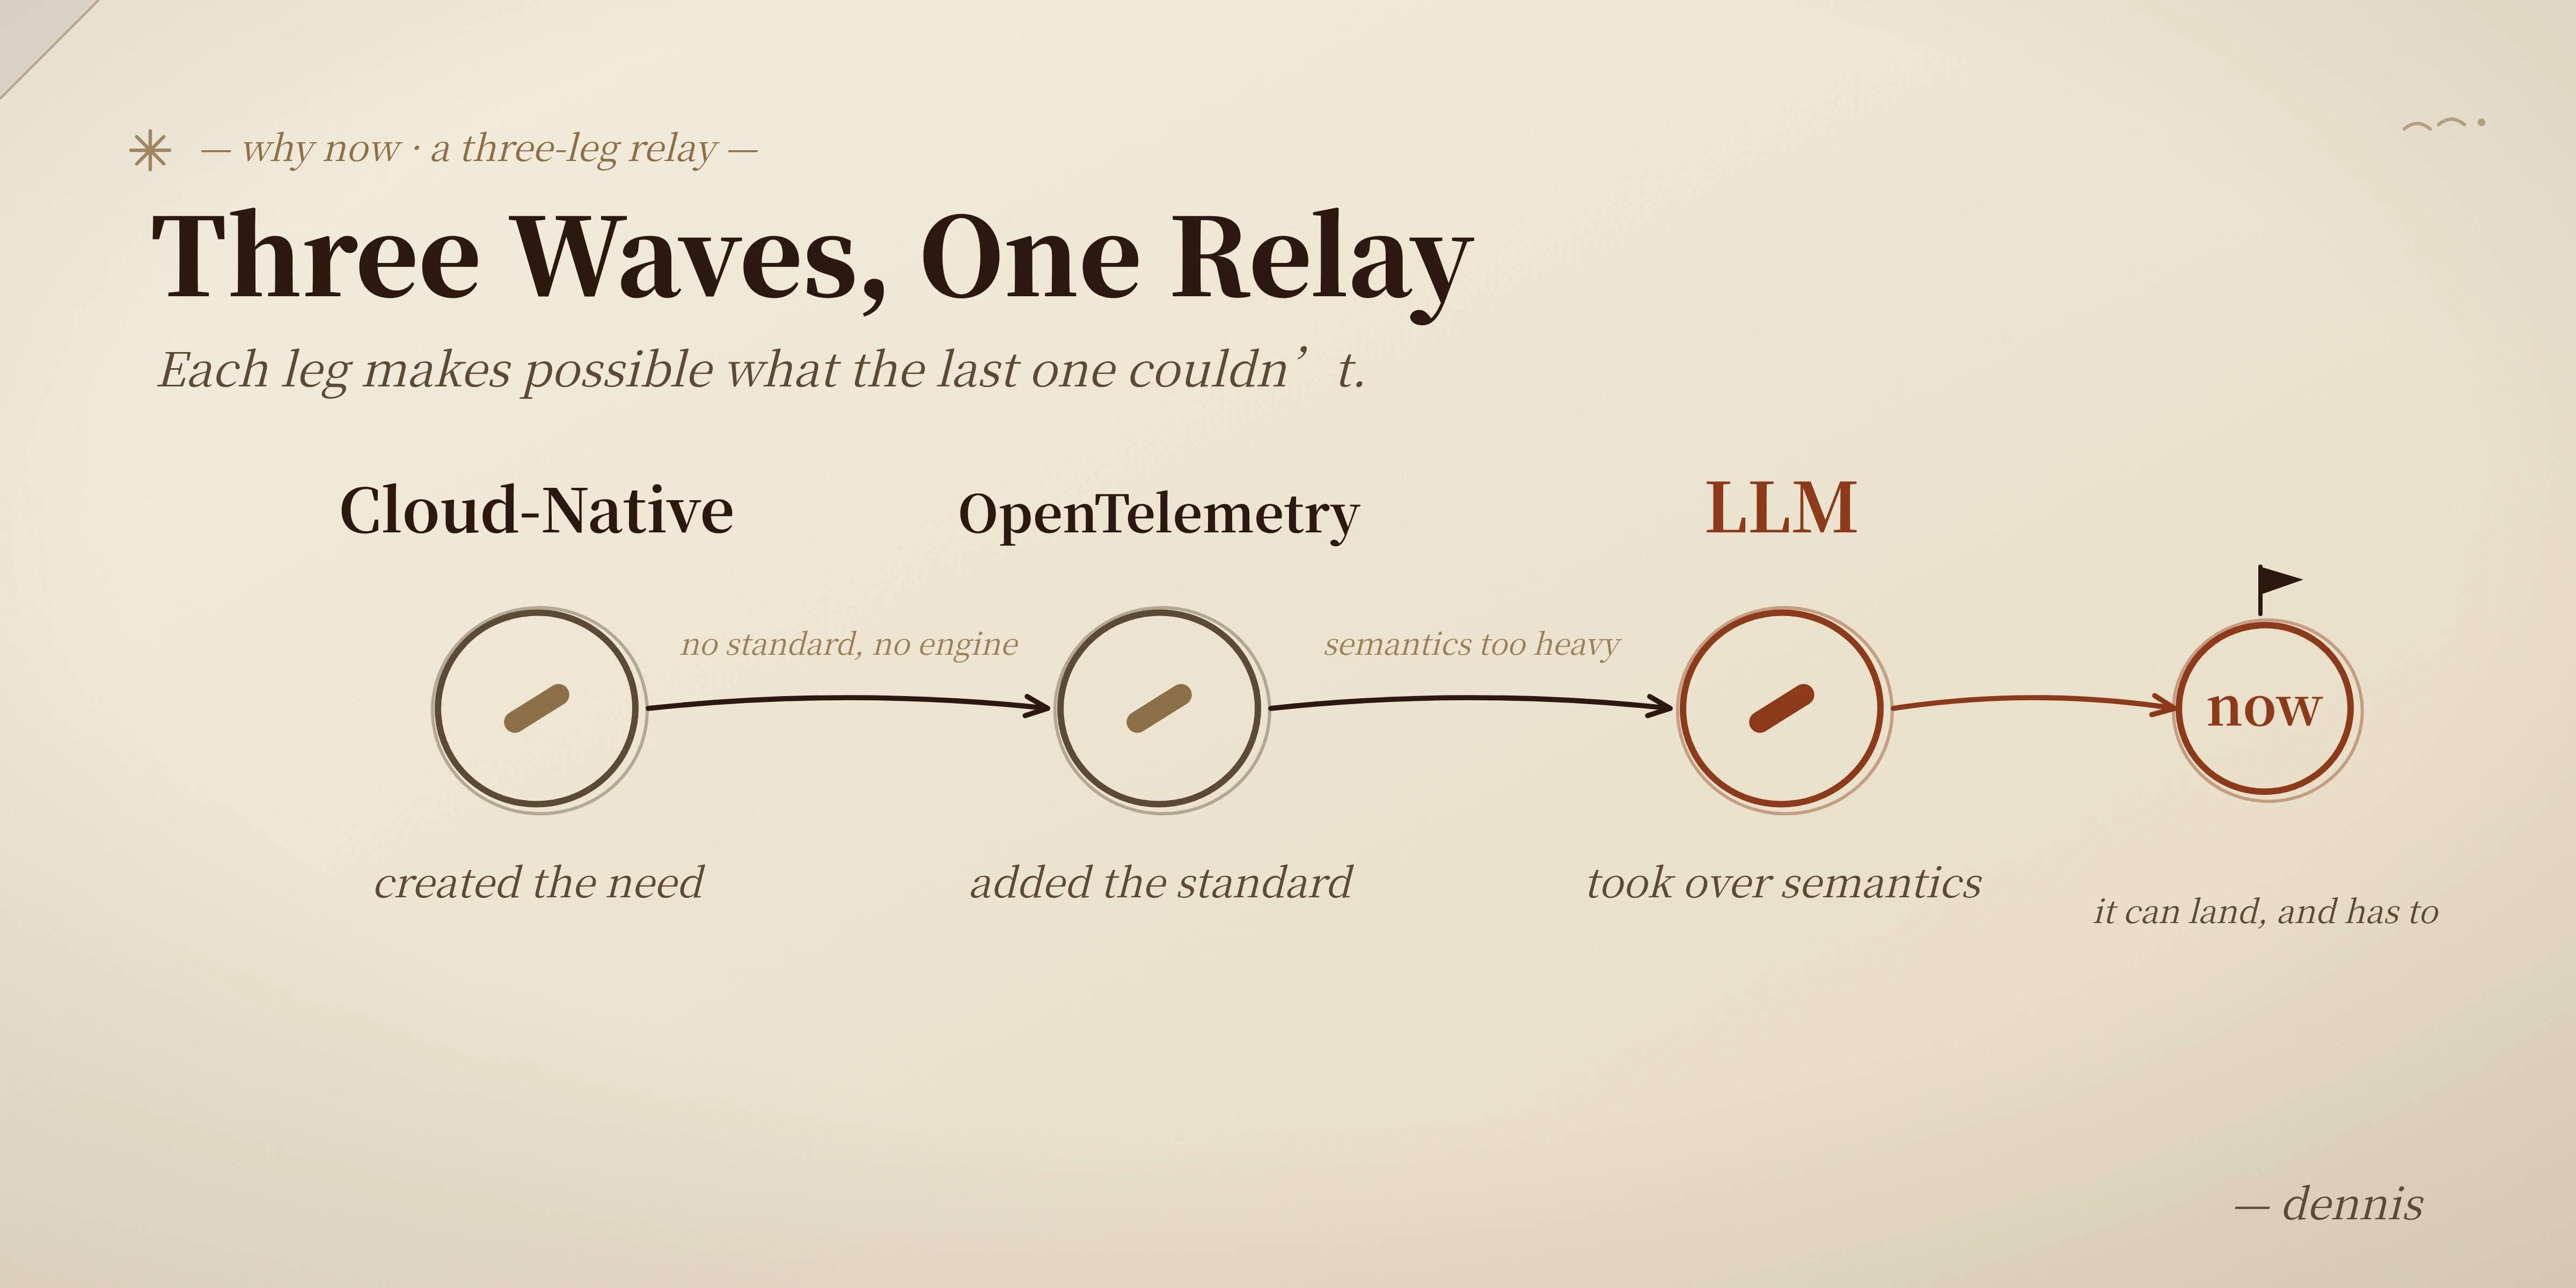
An idea someone had fully worked out back in 2018, yet it took eight years before it could actually be built. This piece is about one thing: why now. An idea someone had fully worked out back in 2018, yet it took eight years before it could actually be built. This piece is about one thing: why now. I ended the last piece with a question. The idea of unified observability, dating from Bourgon’s über-system thought experiment back in 2018, is now almost eight years old. Smart people conceived it, knowledgeable people critiqued it, and startups did build unified storage: SigNoz and ClickStack both cram all three signals into a single columnar store. But nearly all of those systems are built on borrowed, general-purpose engines, and every one of them was designed for a single consumer: the human. Nobody has started from the access patterns of the three signals and redesigned that unified engine for the new consumer now arriving. So what were these eight years waiting for? My answer: unification had to wait for the value and the conditions to flip at the same time. For years the value was mild (nice if you did it, fine if you didn’t) and the conditions were missing, because it was technically rough. Only in the last two or three years have the two lined up: the value went from a nice-to-have to a hard requirement, and the conditions went from out-of-reach to all-parts-in-place. What pushed the value side from mild to urgent is the arriving age of agents. Cloud-native and cost weren’t the main drivers. The payoff from unifying observability has changed over the years, and it keeps getting bigger. In the monitoring era, unification was a nice-to-have. You had Prometheus for metrics, ELK for logs, and later Jaeger for traces. Three systems were mildly annoying, since debugging meant hopping between a few UIs, but you could live with it. All unification bought you was “one fewer component to operate.” An optimization, not a necessity. Nobody rips everything up just because they’re running a couple extra systems. With microservices and cloud-native, the value started turning into real money on the books. The granularity and volume of signals exploded together, and observability data costs climbed high enough to keep a CFO up at night. The most famous figure: Coinbase’s 2021 Datadog bill of roughly $65 million. That number only surfaced because a JP Morgan analyst dug it out of Datadog’s 2022 earnings, as “a large prepayment that didn’t recur.”[1] Coinbase later moved to a self-hosted Grafana + Prometheus setup and cut the cost down. At that scale, unification stops being mere engineering elegance. Three systems each store redundant copies, each bill you separately, and the data still won’t correlate across them. That waste is invisible at small volumes and impossible to hide at large ones. This is where unification first got a reason you could put in an ROI model. Even so, it was still an optimization. If the bill hurts, you can self-host, switch to something cheaper, add sampling and filtering. Painful, but you have options. Agents change the nature of the problem entirely. A human engineer investigates observability data linearly: glance at a dashboard, spot an anomaly in a metric, drill into a service, dig through logs, then jump to a trace to follow the call chain. Each step means waiting for a result and then deciding what to look at next. Because every step has a cost, people naturally query less and query precisely. In that mode, three separate systems are tolerable: you glance at Grafana, glance at Kibana, glance at Jaeger, and stitch them together in your head. The person assembling those three puzzle pieces into one picture is you. An agent doesn’t work that way. It’s parallel and exploratory: it fires off a dozen queries at once to see which ones light up, spawns new queries the moment results come back, zooms in, zooms out, pivots to another dimension, drops the dead ends and digs into the promising ones. The problem is that three siloed systems were never built for that style of querying. Datadog hit this exact wall with its own SRE agent. During a Kafka message backlog, the agent fired off a dozen queries across logs, traces, and metrics at once. One of them had actually found the real culprit, commit latency. But several others came back with unrelated noise, like errors from upstream services, and that noise threw off the model doing the summarizing, so the root cause it reported was wrong. And the more it queried, the more tokens piled into the summarization prompt, until the model either slowed to a crawl or blew past the context window.[2] That’s the cost of making the agent do the stitching at query time: it can get there, it’s just expensive, brittle, and slow. Mismatched field names and misaligned time windows are the classic example. Metrics call it Concurrency is a separate tab. The query side of an observability system is basically built around human pace: one engineer debugging, typing a query every few seconds. Agents throw that out. A single round of exploration is dozens to hundreds of queries, and with several agents running at once you get a swarm bearing down all at the same time. This exact failure, systems built for human speed getting overrun by an agent swarm, has already been benchmarked at the database level.[3] And agents love digging through historical data, exactly the long tail that cheap object storage let you keep around. It used to sit there unqueried; now an agent will actually scan it, concurrently, and cold storage built to save money buckles under that query pattern. This stitching was never purely a human job, either. Mostly it was the monitoring apps people wrote that did it for you: correlating across sources at the application layer, aligning timelines, leaning on a CMDB to map entities to one another. And the CMDB is famously miserable, the thing every company keeps building and never finishes or gets right. Three systems could just about cope back then thanks to people, plus a pile of stitching software, plus a half-built CMDB, barely holding the picture together. You can’t shove that whole apparatus into an agent’s context and have it recompute from scratch on every query. So the more reliable move is to push the stitching out of query time and into the shape of the data itself: have metrics, logs, and traces land on one shared set of semantics and one shared timeline from the start, putting as much determinism as you can into the data layer. For humans, three systems are merely inconvenient. For agents, they basically decide whether the thing works at all. At that point unification stops being an optimization and becomes something you can’t route around. No matter how big the value, it’s worthless if you can’t build it. So, the flip side: why is now the moment it became feasible to build? As the first part of this series argued, the three pillars didn’t split because anyone was short-sighted. Under the technical constraints of the time, doing them separately was simply easier and more likely to turn out well. Unifying wasn’t impossible, but you’d be pushing uphill against engineering gravity. Over the past few years, several of the missing parts have fallen into place. Object storage got cheap. Observability data is a textbook write-heavy, read-light, long-tail workload. Write volume is enormous, but apart from the slice feeding real-time anomaly detection, most of it is never read again; only a small fraction gets queried repeatedly. That kind of workload used to be expensive to keep around long-term, compliance cases aside, since local disk cost too much. Object storage like S3 has kept getting cheaper per unit, and with cold-archive tiers, long-term retention finally pencils out. You can just keep the data. Columnar storage and vectorized execution matured into an ecosystem. Apache Arrow, DataFusion, Parquet: after 2020 these turned into a foundation you could build on directly. Building a query engine that handles several workloads at once used to mean starting from zero; now you stand on top of these components. It’s badly underrated how much this cut the effort of building a unified engine. Rust went mainstream in data infrastructure. C++-level performance with memory safety matters a lot for an engine carrying metrics, logs, and traces at once. InfluxDB 3.0 was rewritten in Rust on Arrow/DataFusion, and Databend and GreptimeDB ride the same wave. A complex multi-workload engine like this used to be one careless slip from a segfault or a data race in C++; Rust makes it maintainable again. OpenTelemetry standardized the collection layer. This picks up a thread from the last piece: OTel’s biggest practical effect is cutting migration friction by an order of magnitude. Swapping observability backends used to mean rewriting all the instrumentation in your code, so nobody dared. Now, if your app speaks OTel, any backend that supports OTLP can step in. That knocks down the tallest wall for every newcomer. Most of these are hardware and engineering maturing. The last one is the most counterintuitive, and to me the most important: LLMs made teaching the database to understand observability unnecessary. Building unification used to hit one unavoidable problem: the database had to “understand” what it was storing. What a trace is, the causal links between spans, how to compute the rate of a counter-type metric, how to order severity levels. You had to hard-code a mountain of observability domain knowledge into the engine. That path is heavy and never really ends: every time the spec updates, you’re chasing it again. But an LLM already absorbed all of that during training. The OTel semantic conventions, Prometheus naming habits, the causal model of a trace. Hand it a table and it can infer the semantics from the field names alone. So the database no longer has to “understand” observability; the LLM took that over. Its job drops from “understanding” the semantics to “aligning” them: tell the LLM which concept a table maps to, and how the tables and fields relate, and it does the rest of the reasoning. That lifts the heaviest, hardest part of unification off the database’s shoulders. Value turned urgent and the conditions came together. Why would those two hit the same moment? Not coincidence: they’re successive swells of the same wave. Line up the three shifts and the relay shows up. Cloud-native is the first leg. Microservices, containers, and serverless broke systems into hundreds or thousands of moving parts, and the volume and granularity of observability data blew up with them, past what three siloed systems could hold up under. It created the real need for unification. It answers the “why bother.” OpenTelemetry is the second leg. It standardized collection and semantics, giving the data one cross-system representation for the first time. That both drove down migration cost and gave the database a real shot at reading the data. The LLM is the third leg, and it does more than one thing. Most directly, semantics: it takes them all the way, so the database doesn’t even need to “understand.” Then consumption: the parallel, exploratory way an agent queries pushes unification straight from an optimization to a hard requirement, the point from section 1. And one more: agents set off another data explosion on the way. The cloud-native explosion came from splitting systems into thousands of parts; this one comes from the agent itself, a nonstop producer of observability data. Every plan, every tool call, every stretch of reasoning, every memory read and write is an event to record and observe, with fields that are many and messy, easily hundreds of dimensions. In raw cardinality it dwarfs the cloud-native era. In a separate piece on agent observability, I ran the numbers: an agent app at a million DAU can push a terabyte of observability data a day.[4] So the agent is a strange double: the most demanding consumer of unified data, and the producer that kicks the volume up another level. And each leg closes the gap the last one left. Cloud-native created the need, but there was no standard and no suitable engine yet; OTel supplied the standard, but actually using those semantics was still too heavy for the database; the LLM takes “understanding the semantics” off its plate, the load falls away, and it drags the need from “better to unify” to “have to.” The three pillars split back then, at bottom, because at that moment unifying was both undoable and not that necessary. Eight years on, both premises have flipped at once. That’s the “why now”: not one technology suddenly maturing, but three waves running a relay, carrying an idea that was fully worked out in 2018 to the point where it can land — and has to. “Why unify” and “why now” are both settled now. But the most concrete question is still untouched: once the moment’s actually here, what should the database layer do? Cram all three signals’ processing into one engine and build a do-everything monolith? Or, given how capable LLMs already are, can the database do less, and stay more restrained? This is the easiest place to get it wrong. Before I worked it out, I went down two wrong paths myself. The next piece, the last in the series, gets to GreptimeDB’s own answer: faced with unification, what an observability database should do — and, more importantly, what it shouldn’t. Datadog’s $65M/year customer mystery solved: Coinbase’s 2021 Datadog bill was about $65M, derived by a JP Morgan analyst from Datadog’s earnings report. ↩ How we built an AI SRE agent that investigates like a team of engineers: an early version fired 12 tool calls across logs, traces, and metrics on a single incident; noise led to a wrong summary; and more tool calls grew the summarization prompt’s input tokens linearly, slowing the model or overflowing the context window. ↩ AI Agent Workloads: PostgreSQL vs CockroachDB Performance: a transactional-database benchmark, where humans issue a transaction every few seconds, a single agent dozens to hundreds per second, and a single node saturates under thousands of concurrent agents. Used here as an analogy for systems designed for human speed getting overrun by agent concurrency. ↩ Agent Observability: Can the Old Playbook Handle the New Game?: an estimate of agent observability data volume, where a million-DAU app can reach a terabyte a day, with fields running into the hundreds of dimensions. ↩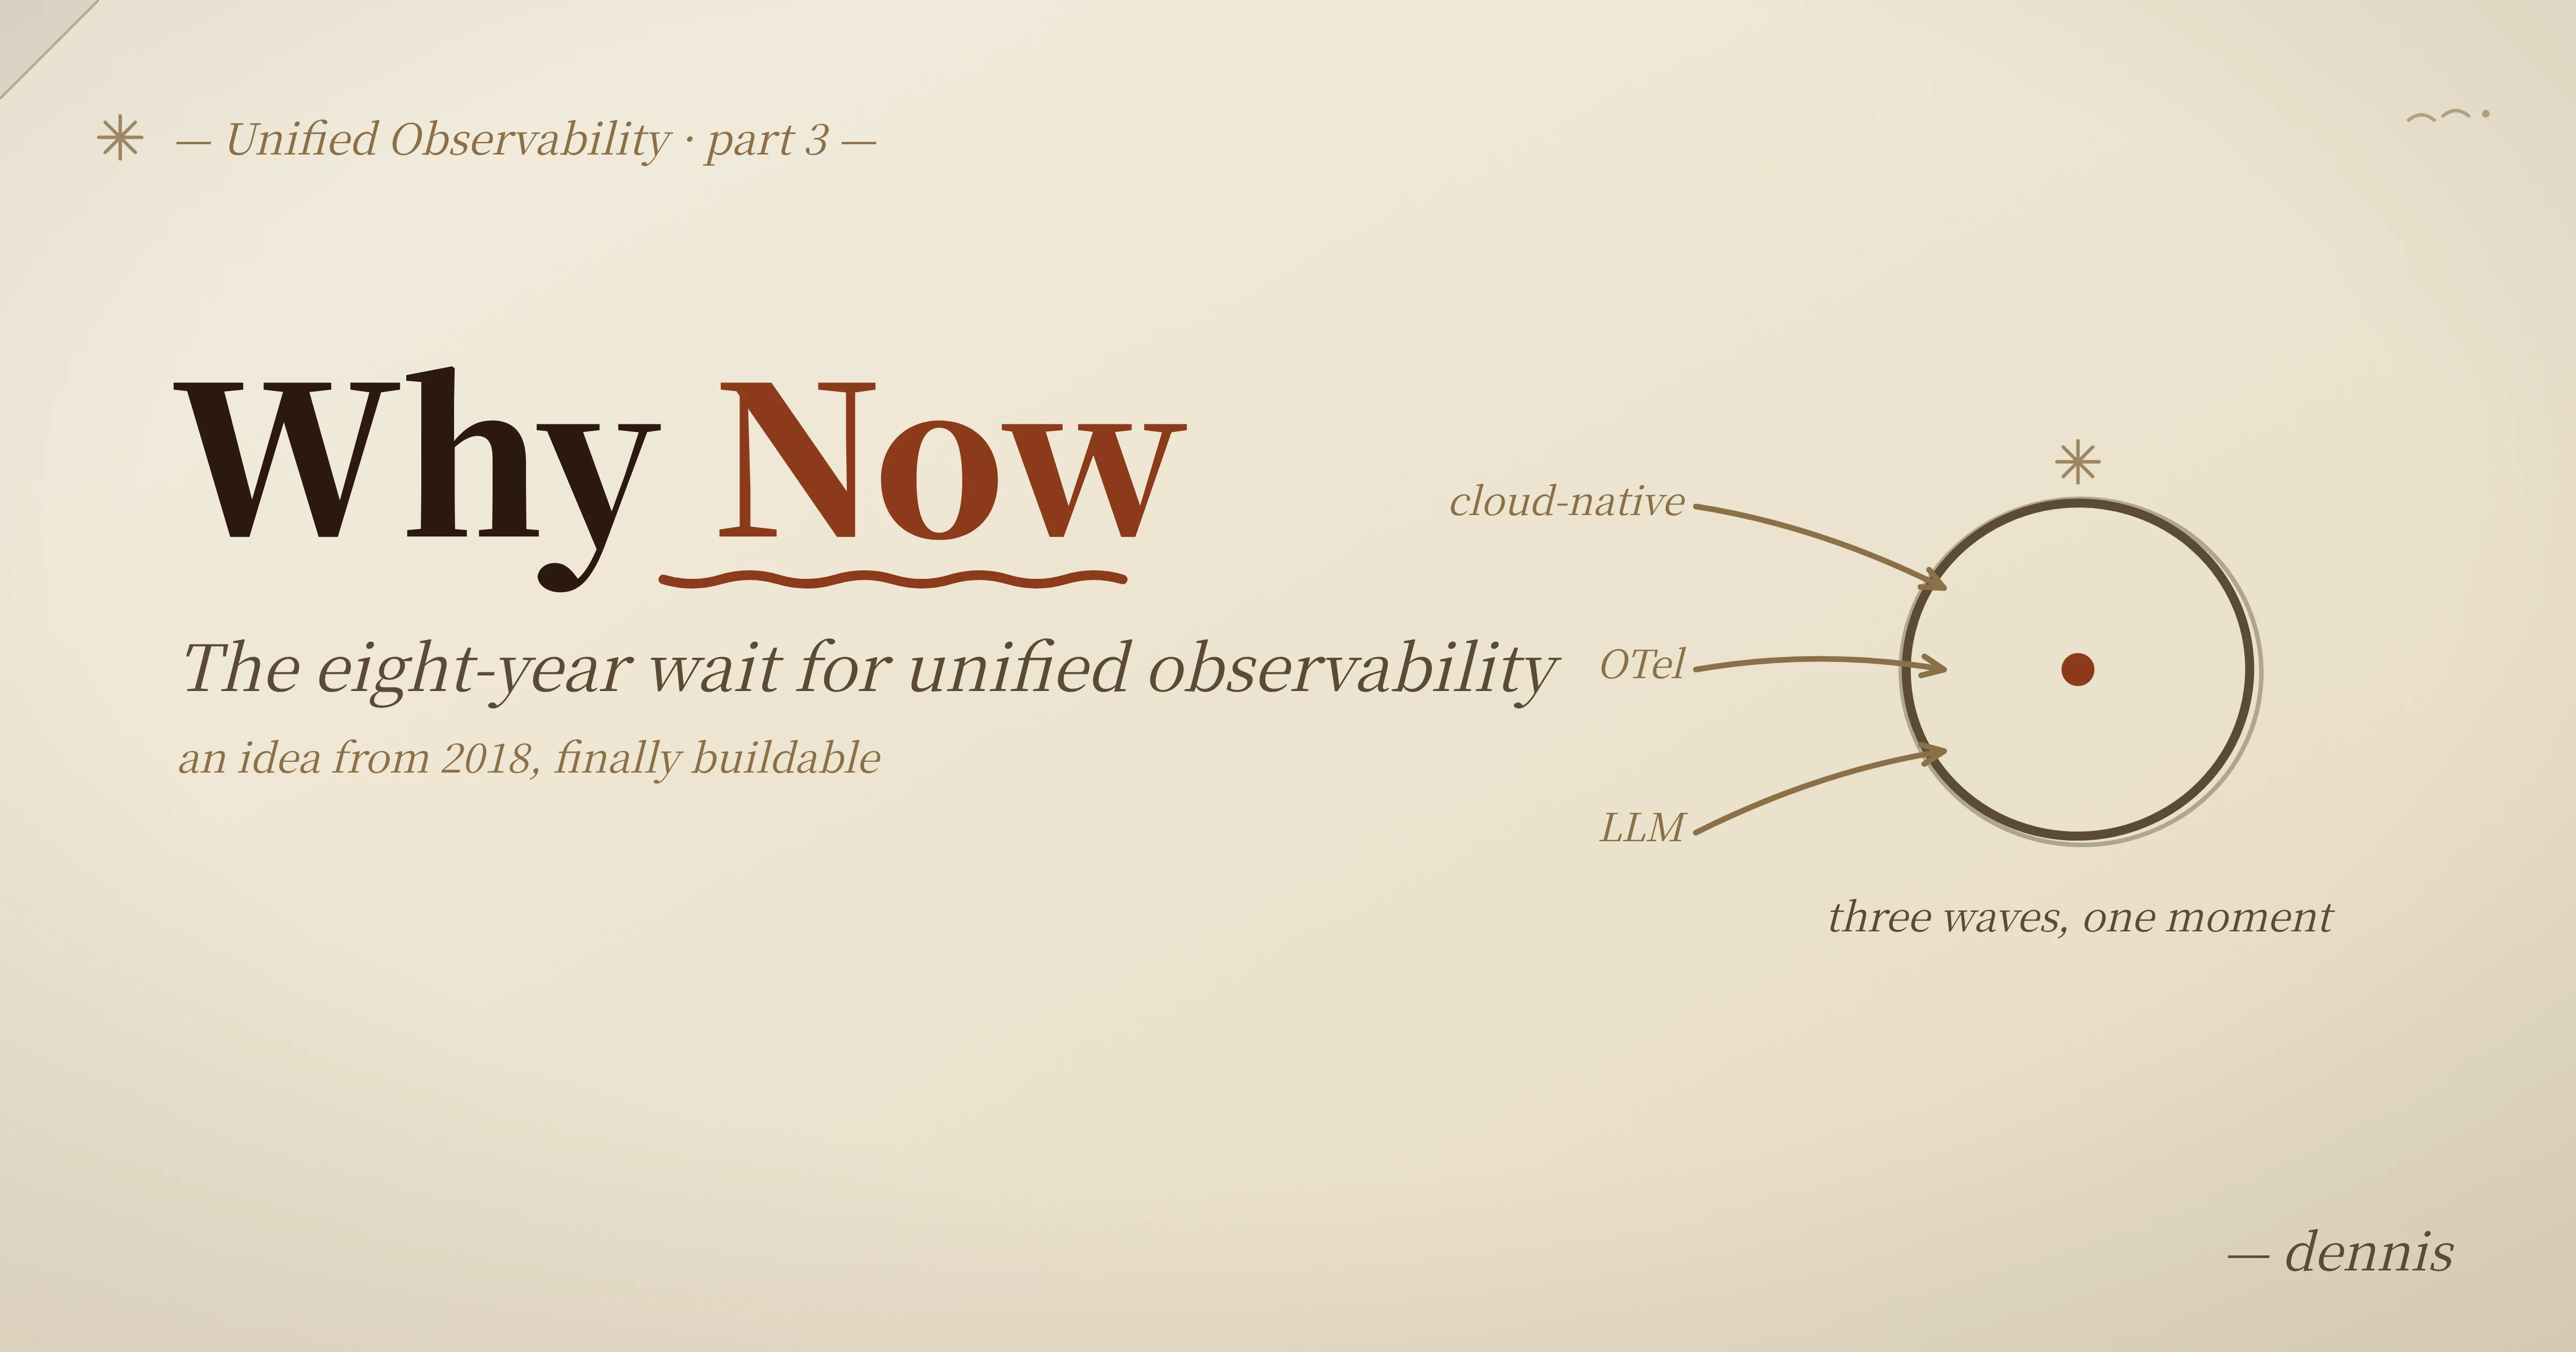
1. Value: from “one fewer component” to “unification is non-negotiable”
service, logs call it service_name, traces use yet another convention. A human matches them at a glance; the agent needs you to hand-write rules in the prompt to teach it, and miss one and the correlation breaks.2. Conditions: the missing parts are now in place
3. Why these two things landed at the same moment
So what do you actually do?
The series
References