I Burned 23 Billion Tokens to “Rewrite” Langfuse
Table of Contents
A migration retro: forking Langfuse to swap its analytics store from ClickHouse to GreptimeDB, run mostly by two AI agents. Most of the work was paying down the debt of one decision — make a single database both the source of truth and the analytics layer. TMA1 broke down this project’s token spend by cwd (the project is a Langfuse fork). Claude Code came to That number is less scary than it looks. 98% of it is cache read (23 billion), prompt-caching hits that are basically free. The real non-cached input + output is only 123M. Codex adds a rough couple hundred million on top, again mostly cache. Two AI agents (Claude Code + Codex), twenty-some billion tokens, and what they did was swap the analytics store under Langfuse from ClickHouse to GreptimeDB. The product, the API, the SDK: not a line touched, which is why “rewrite” gets the scare quotes. The fork is called Openfuse. What follows isn’t a release post. It’s a migration retro. The whole thing came down to one bet: take the source of truth off S3 and let a single GreptimeDB instance be both the truth and the analytics layer. Most of the article is about paying down the debt that decision created. I ran the migration mostly with two agents driving, which is where the tokens went; but what got it to run wasn’t the model, it was engineering discipline. Openfuse is a hard fork of Langfuse (v3.184.1). The main line is one thing: move the analytics store from ClickHouse to GreptimeDB. Postgres stays put: it still holds users / projects / prompts / API keys and the rest of the app and config data, with schema and migrations lifted straight from upstream. Redis / BullMQ stay too. What moves is traces / observations / scores and all the analytics data behind the dashboards; GreptimeDB now carries all of it. But “just swapping the store” is a simplification. To make it run on its own, the deployment shape and some object-storage paths changed too. Object storage is now optional and defaults to local files, and there’s a standalone mode (web + worker bundled) you bring up in one command: For small-to-mid self-hosting, object storage is too heavy. Why do this? LLM traces are observability data. High-cardinality, timestamped Wide Events are exactly GreptimeDB’s data model. Running on one unified observability database instead of welding onto a single-purpose column store buys a few concrete things today: Downsides exist. It’s alpha. Some query semantics, approximate queries especially, don’t fully match upstream because the underlying storage differs. And there’s no in-place migration: no tool to move existing ClickHouse data into GreptimeDB, so it’s a fresh install only. See known limitations. The thing that ate the most time was reconciling the semantics of the two stores. Before the pitfalls, one architectural decision, or the rest won’t make sense: the source of truth moved from S3 to a single How Langfuse worked before: an event comes in, gets uploaded to S3 (the event store, the source of truth), a message goes onto BullMQ, a worker downloads, parses, and enriches it (filling in prompt / model / cost), then a batching, async-flushing Now: the API takes the event and appends the raw envelope straight into Two reasons. One, it’s simpler: one fewer S3 event store, one fewer replay path, truth and analytics in one database, and a single system to back up, restore, and reprocess. Two, the write path has a different shape. ClickHouse dislikes high-frequency small writes: you batch, flush async, and lean on MergeTree background merges, which is why upstream puts S3 in front as a buffer with a batch writer ahead of it. GreptimeDB’s write path (Mito Engine + WAL) is better suited to taking real-time appends directly. So I land raw events straight into That decision also forced a string of semantics-alignment pitfalls. In ClickHouse, traces / observations / scores are all GreptimeDB’s “last” goes by write sequence (a monotonically increasing per-Region write counter), not by the value of In a system that retries, replays out of order, and reprocesses concurrently, that’s fatal. Two options: add field-level version guards in the worker (track the largest I changed the approach: full replay from Full rebuild has a prerequisite: complete history. That leads to the most concrete constraint after dropping the S3 SoT: So in this architecture, TTL can’t be a cost-shedding lever anymore (short of adding checkpoints / snapshots later). That’s the price of putting truth and analytics in one database. ClickHouse’s This one rippled the furthest: enrich, converter, filter DSL, and query builder all had to follow. The JSON v2 GreptimeDB is currently designing could borrow more from CH; that Map / function setup really is nicer to write queries against. Aligned to what degree? The read path ended up byte-for-byte against upstream. The few intentional differences all sit on the equal-or-more-correct side of the fork (percentiles via This design has a hard cost. Every incoming event means reading that entity’s whole history, rebuilding it, and writing it back to the projection and EAV; and since TTL can’t truncate history (it has to stay for replay), shedding load by storing less is off the table too. The first backfill load test didn’t even finish; the worker stalled partway. Three bottlenecks turned up. The worst: the ingester’s protobuf encoding was synchronous, hogging the worker’s event loop and starving the raw_events reads, and only moving it into a worker-thread pool freed it up. The other two were lighter. The raw_events point read degraded into an in-memory scan while data sat unflushed, so I added a timed flush scoped to just that table. And when draining a backlog the same entity got rebuilt over and over, so a watermark skips the redundant rebuilds. After that it drains to completion reliably, but only to “completion” — the write side still needs tuning. Queries are slower, especially the observation aggregations that go through EAV joins. So the alpha label isn’t modesty; write and query both aren’t there yet. What holds up today is two things: it’s lean, and it’s simple. On my parity/backfill dataset, the same data fit into a single GreptimeDB volume (raw_events + projections + EAV) at roughly an eighth of upstream’s footprint (ClickHouse plus a MinIO bucket for event blobs). Don’t extrapolate the number, but the direction is clear. And the stack is simpler: one engine holds everything, with no separate object store to operate. Normally indexing is the main lever. GreptimeDB’s read performance largely hinges on two things landing: Time Index range pruning, and indexed-column pushdown. For a query filtered by time range + an indexed column, if the predicate pushes down into the Region scan, the engine prunes most of the data at the file / row-group level and reads only what it needs. If it doesn’t push down, it’s a full scan. The bug we hit sits right on that line. Under load testing, the same predicate prunes fine on a single table, but the moment that table sits under a JOIN, pruning disappears and the scan degrades to a full table scan. It traces to a real GreptimeDB planner bug (#8338): when a table filtered by a TIME INDEX (or an indexed column) sits directly under a JOIN, the predicate doesn’t push into the Region’s A and C both prune to 1 file_range and 200 rows; B scans 30 file_ranges and 6000 rows. At production scale (wide tables of 100K to 1M+ rows), that’s the difference between a few-millisecond pruned read and a multi-second full scan. The workaround is to rewrite the SQL: wrap each filtered base table in a subquery so the predicate attaches to the scan before the JOIN (form C). Until the bug is fixed, the app layer just carries this rewrite. Compaction is the main lever in the backfill case. GreptimeDB’s writer flushes roughly once a second under load, so high-frequency writes or a backfill quickly produce a pile of small SST files. And by-type dashboard query latency is dominated by how many SSTs the scan has to merge. Measured on the same query (~3.5M observations): 1022 uncompacted SSTs took 9.6 seconds; after Up to here, everything Openfuse does is about matching Langfuse. Swapping ClickHouse for GreptimeDB with the same features is, at best, an OpenSearch-to-Elasticsearch story: worth something, not enough. The real reason is that GreptimeDB is a unified observability database: metrics, logs, traces in one engine, native PromQL / TQL, ingest pipelines, Flow continuous aggregation, native OTLP, object storage underneath. Those capabilities open up a batch of directions that don’t grow naturally out of Langfuse’s current structure. To be clear up front: none of this ships yet; it’s the direction the fork is taking (tracked in issue #8): Openfuse = running LLM engineering on a real observability database, not one more tool welded to a single store. That’s why I’m willing to maintain a fork that diverges permanently from upstream. I ran this migration mostly by directing two agents (Claude Code + Codex), with Copilot reviewing on GitHub, the whole thing coordinated through TMA1. Those two token bills at the top are what TMA1 recorded. Mostly it was tiring. Not because it was slow, but because it was fast. The agents push quick, so you can’t stop; you keep wanting one more step, without the natural breather of waiting on a compile or a test. Quality beat my expectations. Claude Code / Codex writing, Copilot reviewing, TMA1 holding context across sessions: the combination delivered well. With a few conditions: smoke-test early, verify the critical paths by hand, diff byte-for-byte against upstream. The gap between “looks right” and “is right” that an agent hands you, you have to cross yourself. The read path matching upstream byte-for-byte didn’t come from trusting the agents; it came from smoke tests and a parity harness. Whether AI can pull off a big rewrite comes down not to how strong the model is but to engineering discipline: break milestones down, realign plan and implementation regularly, put a check gate at every critical point. Do that and delivery holds up; skip it and you’ve just handed a one-liner to an agent and taken on the debt. Openfuse is still alpha. Code and issues are on GitHub. Come kick the tires.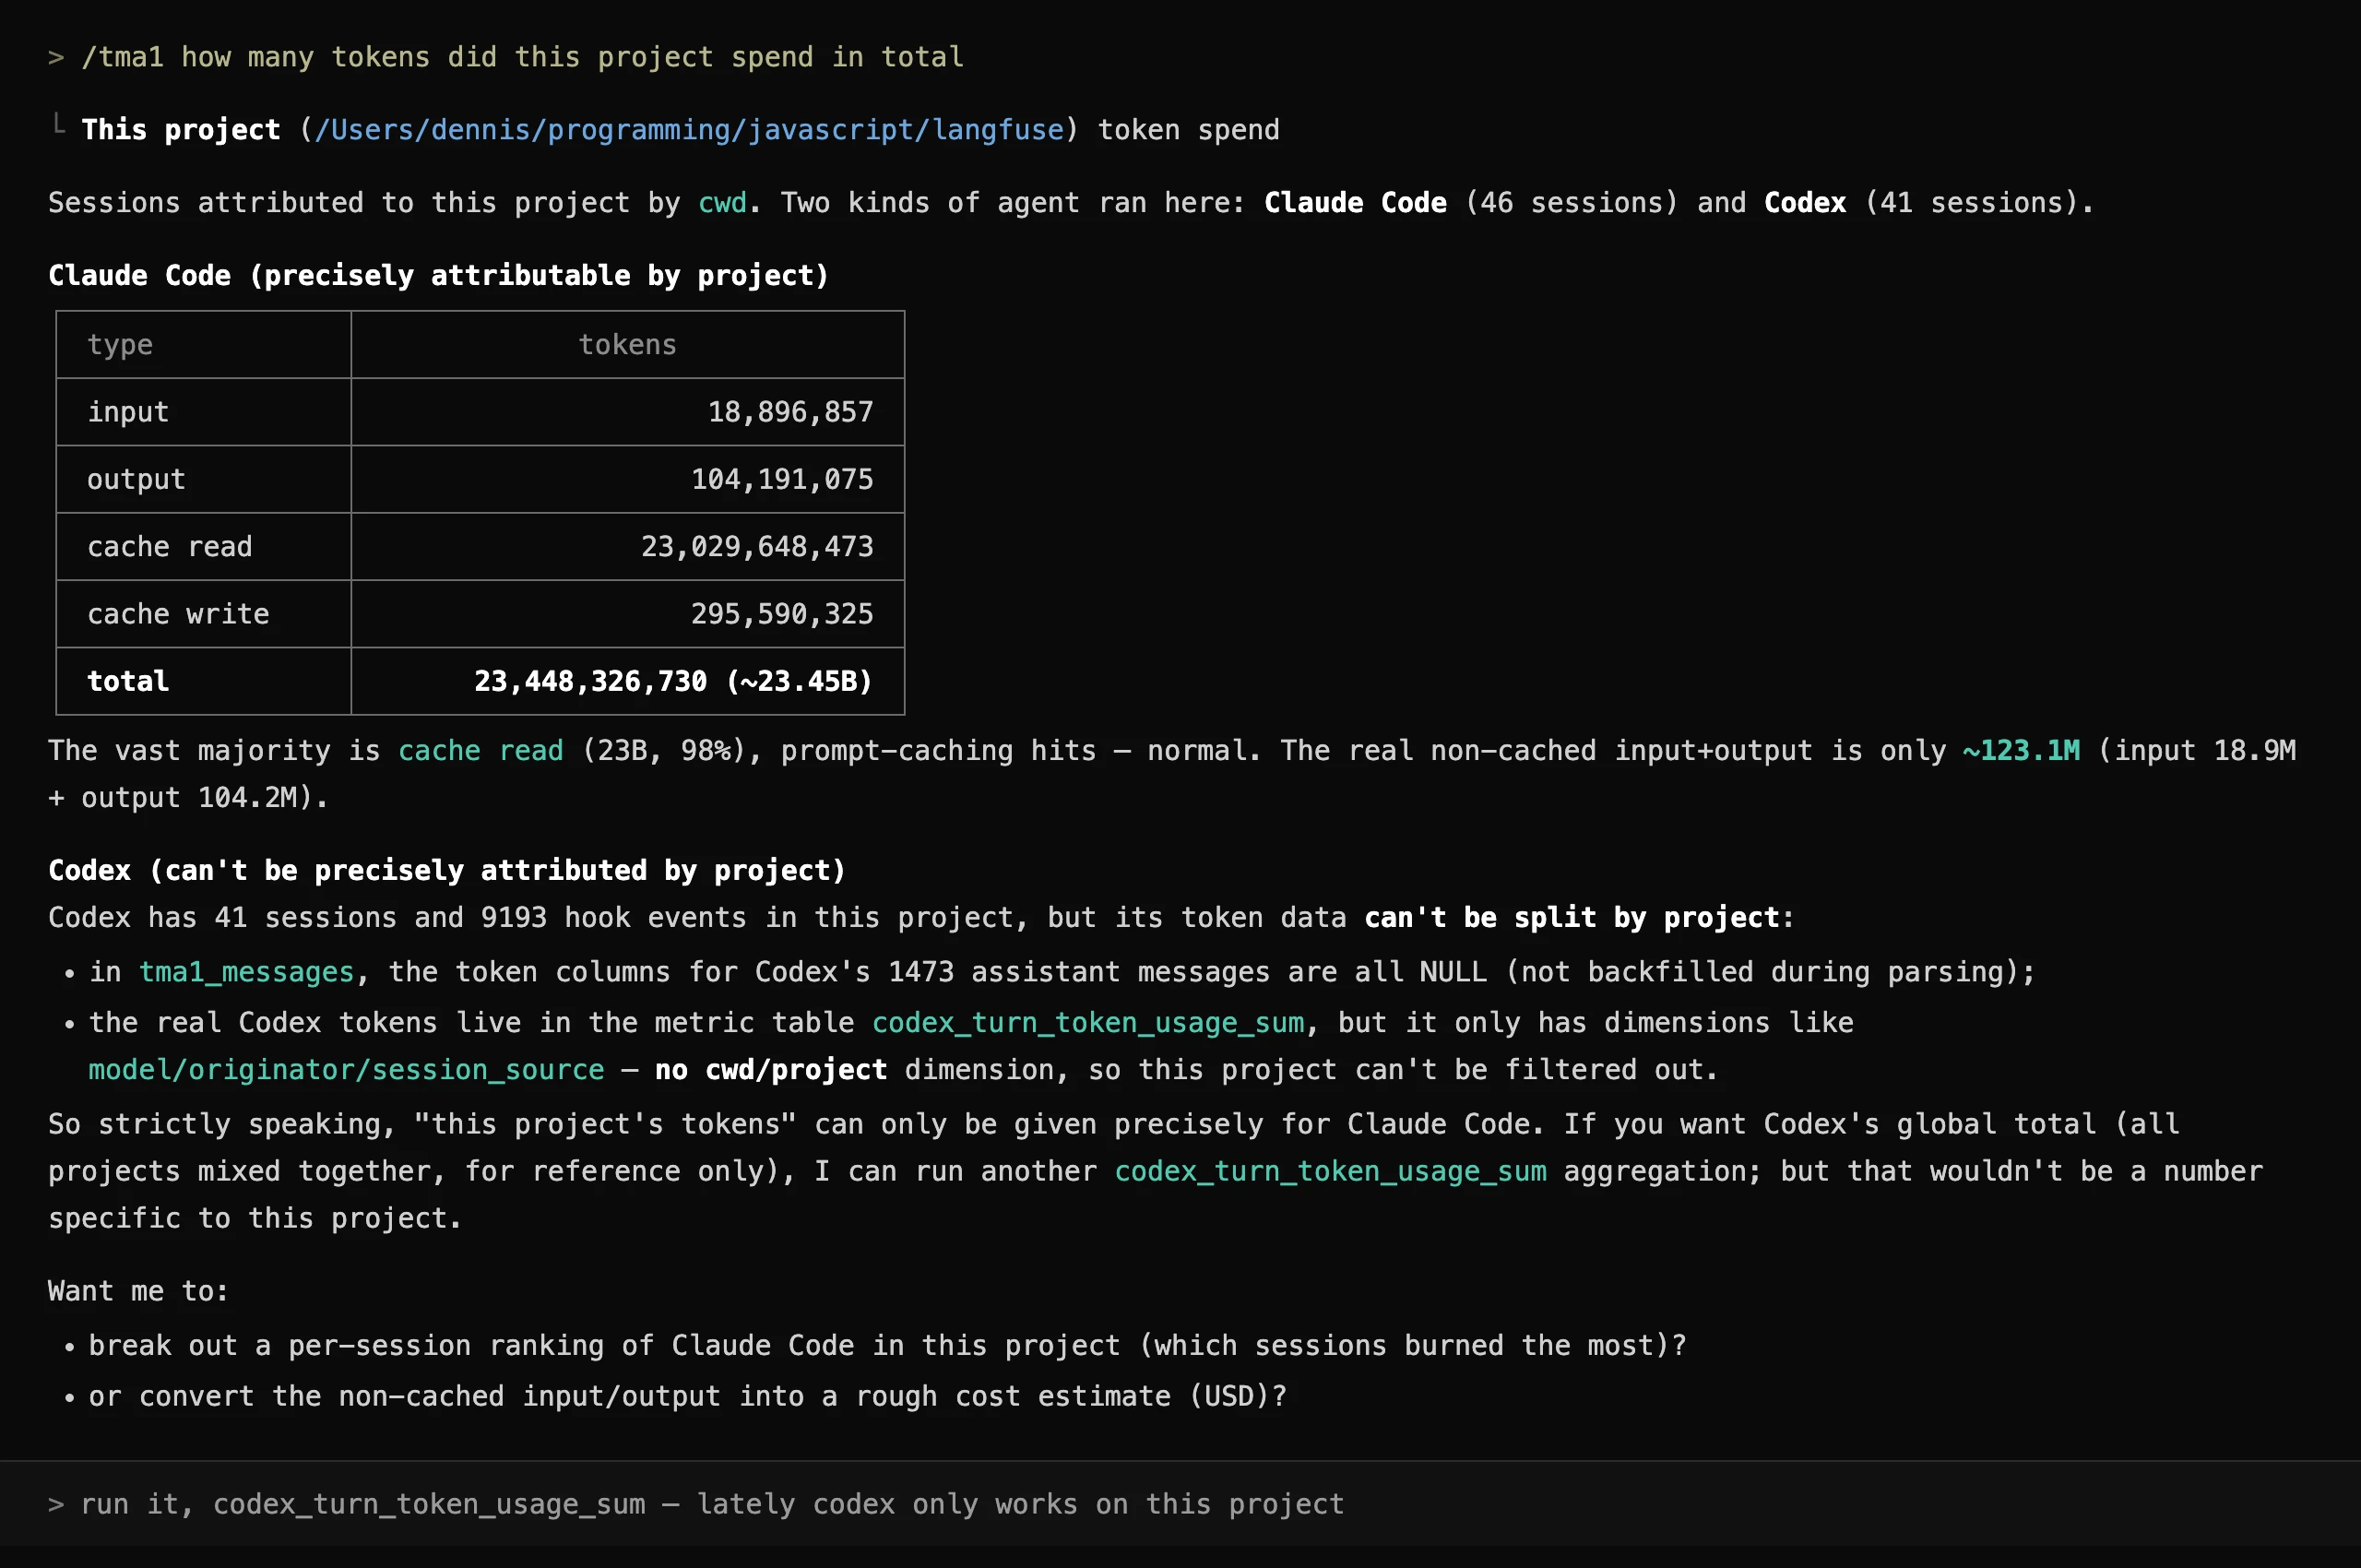
23,448,326,730, about 23.4 billion.Openfuse: running LLM engineering on a real observability database
git clone https://github.com/tma1-ai/openfuse.git
cd openfuse
cp .env.quickstart.example .env                        # working dev defaults — no edits needed
docker compose -f docker-compose.standalone.yml up -d  # one app container + Postgres/Redis/GreptimeDB
openfuse-standalone container runs the whole thing: web + worker in one process, talking to Postgres / Redis / GreptimeDB. Data lands on local disk or object storage, and the same engine scales from one node to a cluster as data grows. With persistence and object storage set up right, scaling the compute layer doesn’t lose analytics data.Why the source of truth became raw_events
raw_events table in GreptimeDB.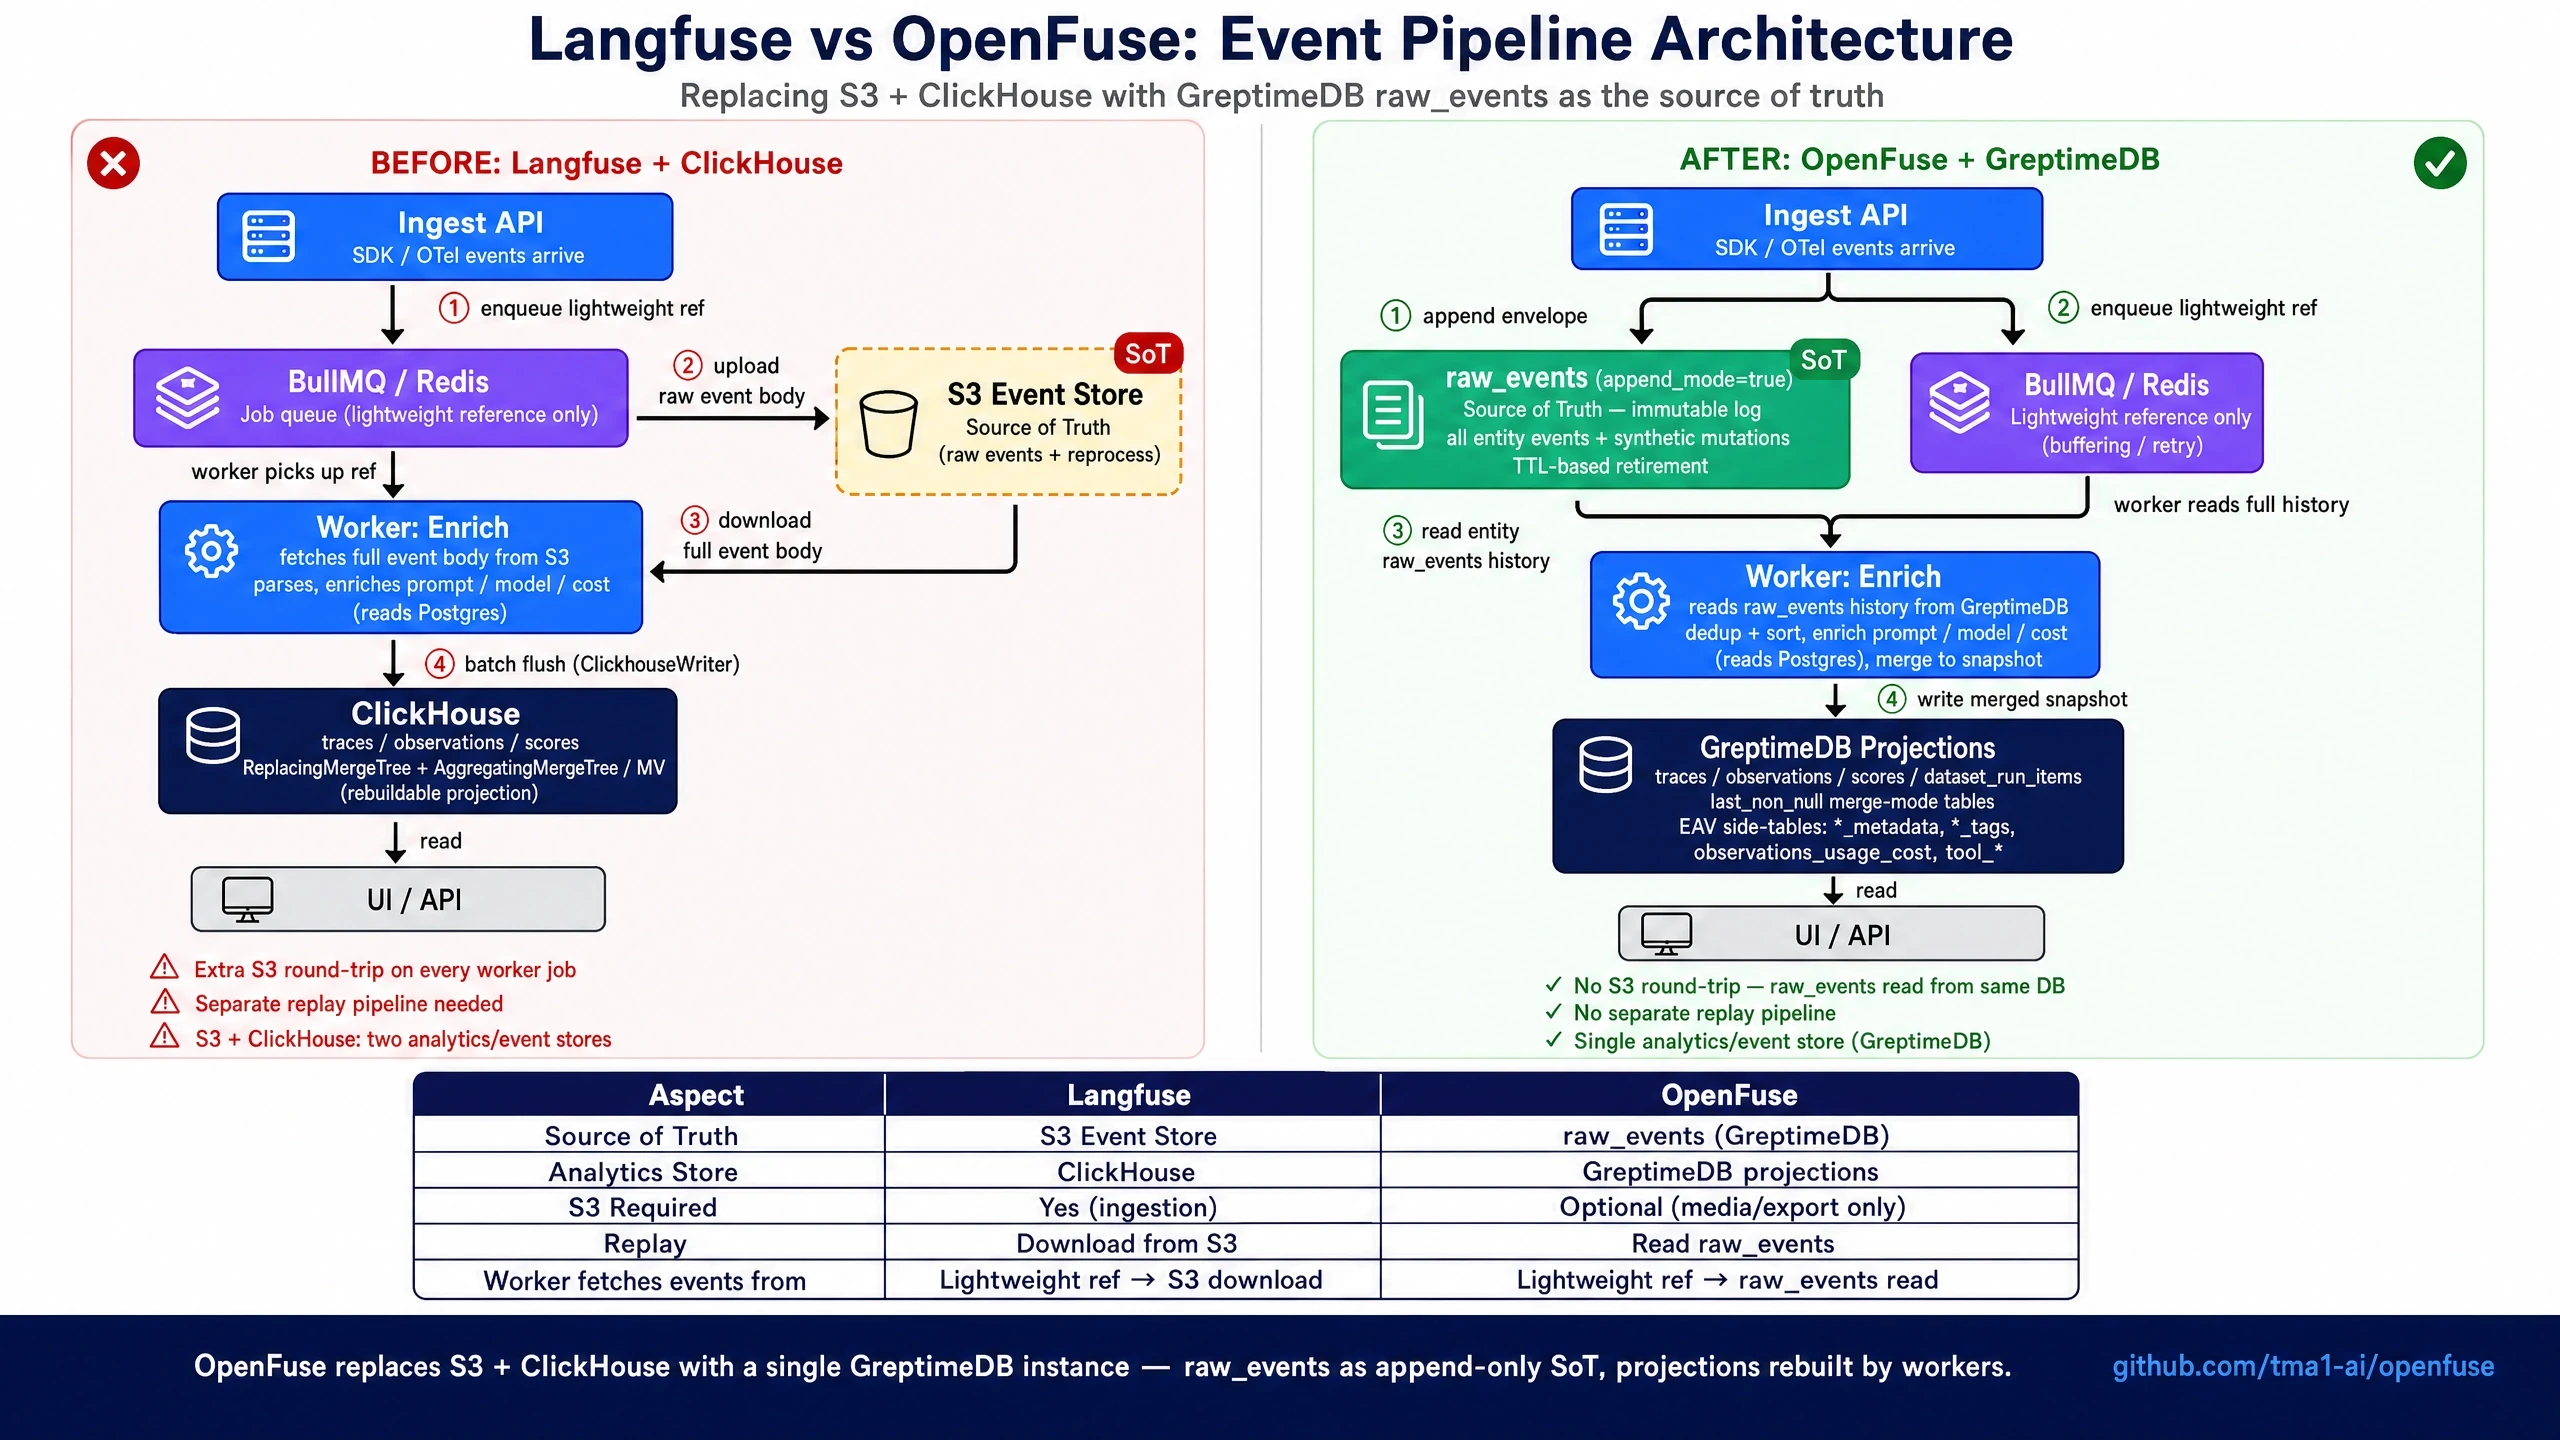
ClickhouseWriter writes it into ClickHouse. S3 is the truth; ClickHouse is a rebuildable projection.raw_events (append_mode); BullMQ only carries a lightweight reference. The worker reads the entity’s full history from raw_events, enriches it, and writes the projection tables. The whole S3 layer is gone.raw_events instead of using S3 as the event store, and that whole tangle of lifecycle management goes away with it.Reconciling the two stores’ semantics
last_non_null keeps the last write, not the largest event_ts
ReplacingMergeTree(event_ts, is_deleted); you read with FINAL, taking the newest by the event_ts version column. GreptimeDB’s counterpart is merge_mode='last_non_null': for the same primary key + timestamp, it merges each field to its last non-NULL written value and backfills partial rows automatically. Looks one-to-one. The catch is in the word “last.”event_ts. I verified it in the PoC: write a logically newer event first, then a logically older one, and the older event that was written later wins. A stale event that arrives late just overwrites the newer value.event_ts seen per field, skip older ones), or change the approach.raw_events. Instead of reading the projection and doing an incremental merge, the worker reads all of an entity’s historical events, orders them deterministically (event_ts → create before update → ingested_at → event_id), merges from an empty object into a complete snapshot, and writes the whole row to the projection. Out-of-order goes away at the root: the rebuild depends only on the set of events, not their arrival order, so no version guard is needed. The cost is that every event triggers a full-history read and rebuild for that entity, so you have to watch the per-entity event count.The cost of dropping S3: raw_events TTL can’t be a cost lever
raw_events TTL must be ≥ the projection’s retention. If a create event expires first under TTL, the rebuild loses that entity’s immutable fields / metadata / tags.Map / Array aren’t first-class, so they get split into JSON + EAV side tables
Map(K,V) + sumMap / mapKeys and Array(String) + has() have no first-class column equivalent in GreptimeDB. So each one gets mapped differently:*_metadata, inverted index on key, skipping index on value) that carries filtering and breakdowns.*_tags.sumMap degrades to SUM(column). The long tail spills into JSON.A few small but annoying ones
id, name, value, key, type, level, timestamp are all keywords in GreptimeDB, so column names have to be quoted consistently.*-create event to raw_events (keeping the SoT complete and replayable) plus write the projection directly (read-after-write, visible immediately).raw_events and drops the current projection / EAV. Replay then rebuilds it as soft-deleted (every query carries WHERE is_deleted=false) rather than resurrecting it.uddsketch approximation, empty time buckets filled with zeros, stricter 400s on nonsensical dashboard queries), and they’re listed in the parity ledger.raw_events as SoT: making it actually keep up
Performance: two levers, plus a GreptimeDB bug
SeqScan; it lands as a FilterExec above the scan, so the scan reads the whole table first and filters after.EXPLAIN ANALYZE makes it obvious. For the same 200 rows:-- A) single table: predicate pushes into scan → 1 file_range, 200 rows
SELECT count(*) FROM parent WHERE ts >= '2024-01-30 00:00:00';
-- B) table under JOIN: predicate doesn't push down → 30 file_ranges, 6000 rows (full table)
SELECT count(*) FROM parent p LEFT JOIN child c ON p.k = c.k
WHERE p.ts >= '2024-01-30 00:00:00';
-- C) filter in a subquery first, then JOIN → predicate pushes back down, 1 file_range, 200 rows
SELECT count(*) FROM (SELECT * FROM parent WHERE ts >= '2024-01-30 00:00:00') p
LEFT JOIN child c ON p.k = c.k;
compact_table collapsed them into one file, 0.2 seconds. So after a big backfill, compact the hot tables manually:ADMIN compact_table('observations_usage_cost', 'strict_window', 86400);
The real reason to fork Langfuse
rate(token_cost[5m]), aggregation by model / project: PromQL expresses all of that far more naturally than hand-writing two layers of group by + uddsketch. Langfuse’s whole query surface is built on SQL, with no mental model for “pick a series by metric + label, then rate / histogram_quantile.” That’s a structural gap, not a flag you flip.trace_id, full-text search via matches_term. Langfuse has no logs surface.Last, on vibe coding