LLMs Already Understand Observability. What Is Left for the Database?
Table of Contents
The last post in this series. The time for unified observability has come, so what should a database actually do about it? My answer is probably smaller than you expect, and "doing less" is what I arrived at after thinking it through. The last post in this series. The time for unified observability has come, so what should a database actually do about it? My answer is probably smaller than you expect, and “doing less” is what I arrived at after thinking it through. The first three posts covered a lot of ground: how the three pillars grew without anyone planning them, how many people tried to put them back together starting in 2018 and didn’t get there, and why the moment is now: cloud native, OpenTelemetry, and LLMs arrived in sequence and pushed unification from “can’t be done” to “has to be done.” At the database layer, what should you actually do? GreptimeDB chooses two things: a lightweight semantic layer, and very strong concurrent query capability. That may sound too little for a database that wants to unify three signals and serve the agent era. I arrived at it after ruling out two more tempting paths. The first wrong path was making the database itself “understand” observability. The impulse is natural. If you’re unifying, the database should understand observability, so give it built-in domain operators: reassemble traces automatically, follow exemplars, analyze service dependencies. Let the engine have native comprehension of observability data. It sounds reasonable, and the result looks like a moat. But there’s a fatal problem: LLMs have already commoditized that knowledge. An LLM learned OTel’s semantic conventions, Prometheus metric types, and the causal model of traces during training. Hand it a table and it can infer the semantics from column names. If your database builds its differentiation on “I understand observability,” that differentiation gets diluted continuously, because the model absorbs this faster than you can ship it. Hardcoded domain operators are also a heavy asset: every OTel spec update has to be followed, every new signal type adapted to. You end up competing for the same ground against something that evolves far faster than you can ship. The second wrong path was the opposite: understand nothing. I then swung to the other extreme: a fully general adaptive engine that carries no domain knowledge and learns how to optimize from actual workloads, using generic mechanisms like partitioning, primary keys, and automatic materialization. It is pure, elegant, and competes with the LLM for nothing. That path didn’t survive comparison with what GreptimeDB actually does. Look at how the trace table is designed: trace data lands in Not one of those decisions was learned by the engine. Each is an engineer translating OTel domain knowledge into the physical design language of a storage engine: So “purely adaptive” is wrong too. Domain knowledge does enter the engine. It just enters at a different place than I originally assumed. Domain knowledge should enter on the write side, through pipelines and physical design. GreptimeDB’s The LLM handles knowing what query to write, which it’s already good at. The pipeline handles making that query fast at the physical layer, which the LLM cannot reach. The two cooperate through SQL, a stable and widely understood interface. Pipelines are also a versioned product asset. SigNoz and ClickStack built unified storage on ClickHouse a while ago, and built it well. So what’s left for GreptimeDB? ClickHouse is an outstanding analytical engine. Its columnar storage, compression, and vectorized execution are more than sufficient for aggregate analysis over observability data. The moment Langfuse switched its read path from Postgres to ClickHouse, latency dropped from minutes to near-instant[2]. That analytical capability is why one observability product after another picked it during the years when no open-source unified store existed. But “a good analytical engine” and “a good observability database” are two different things. Lay out the full set of observability requirements and ClickHouse turns out to be borrowed rather than designed for several of them: Langfuse’s architecture illustrates all of this. They don’t write raw events into ClickHouse. Events go to S3 first, the Redis queue carries only references, and async workers enrich and merge events into a single row before flushing to ClickHouse[6]. They built an S3 + Redis + worker scaffold to supply the ingestion layer ClickHouse doesn’t have. That scaffold belongs to the store, not to the data: an experimental fork of Langfuse running on GreptimeDB drops the S3 event store and appends raw events straight into a table[7]. For observability, ClickHouse is a peculiar combination. It’s overkill, a heavy engine built for general-purpose OLAP, and at the same time incomplete, since native ingestion, PromQL, protocol adaptation, and light operations all have to be supplied from outside. It became the de facto choice for open-source unified storage because during the years when the ecosystem had a gap, it was the best general columnar store within reach. The TimeSeries engine, PromQL, and ClickStack collector it’s adding now are all observability capabilities bolted onto a general-purpose core, which is the direction of that first wrong path: forcing domain knowledge into an engine not designed for it. GreptimeDB goes the other way. Domain knowledge enters through physical design on the write side (that trace table above is the example), the query side keeps standard SQL and PromQL, and the rest goes to the LLM. It doesn’t beat ClickHouse on every dimension, and when I get to the second thing I’ll name one place where it loses outright. What it has is a design aimed at observability plus agents, instead of a general engine patched upward. The LLM needs to know what a specific table holds. Everything else about observability it already learned in training. An LLM already understands OTel semantic conventions, Prometheus naming habits, UCUM units, and how severity numbers order. The database’s job is alignment: telling the LLM which concept this table maps to, which protocol it came from, what transformation it went through, and what got dropped. GreptimeDB exposes table identity through SQL table options rather than an invented protocol: You don’t write these by hand. The auto-create paths (OTLP, Prometheus remote write, InfluxDB, Loki, Elasticsearch) stamp identity at write time. OTLP metrics additionally carry type, unit, and temporality, because the OTLP wire format declares all three and then the row encoders throw them away; once a unit is gone it cannot be recovered from the data. The semantic layer’s job is to not throw it away. One design I like better than my original proposal is The discovery entry point is The metadata might total a few kilobytes, but it lets the LLM apply what it already knows to query the table correctly, with no prompt engineering or few-shot examples. More metadata starts to look like educating the LLM, which slides back onto the first wrong path. This layer still carries an experimental label, and the vocabulary is deliberately narrow. A key earns a place on the whitelist only when it records something a consumer cannot cheaply recover from the schema, the columns, or naming conventions it already understands. Anything already encoded in the metric name (a Prometheus What’s still in progress is the layer above: entities and relationships across signals. The evidence for which service calls which, where a workload runs, and what the topology looked like during an incident is scattered across traces, metrics, and logs. Today you either join it by hand or maintain a separate graph database. The direction we’re working on derives entities and time-ranged relationships from existing telemetry as ordinary SQL tables, with the graph as a logical view rather than a separate graph store[8]. It isn’t finished; the progress is in a public tracking issue. This leaves a larger question: how far should a database go in “understanding” telemetry? My answer is to preserve the semantics, let them inform physical design, but not compile domain operators into the engine. Where exactly that line belongs, and what a system has to satisfy before it deserves to be called an observability database, is the subject of a separate post on the Greptime blog. The LLM also needs to look at data freely and at scale. Humans query linearly: few queries, aimed carefully. Agents query in parallel and exploratively, issuing many at once, discarding the ones that miss and going deeper on the ones that hit. What that pattern demands from a database has almost nothing to do with how fast a single query runs. It’s a different set of things: high concurrency to absorb many queries at once, elastic scaling to spin up compute when it gets busy, low cost because exploration has a high failure rate, and predictable latency for the agent’s planning to rely on. Those happen to be what columnar storage plus object storage plus compute-storage separation is best at. That architecture optimizes for high concurrency, strong elasticity, and low cost over large volumes of data. Minimal single-point latency is not what it is tuned for. On absolute single-query metrics performance, GreptimeDB loses to systems like VictoriaMetrics that are purpose-optimized for it. We have worked on this for years and are still working on it, but an architecture that puts object storage under everything pays a cost that tuning does not erase. In the past this was a clear disadvantage. In the agent era it matters less. An agent wants to launch large-scale parallel exploration at once, and VictoriaMetrics’s relatively monolithic architecture, tuned hard for single-point performance, handles that wide, scattered workload poorly. The trade-off is the same one; what changed is the workload it gets measured against. A lot of past “performance weaknesses” need the same repricing. Performance still matters; the question is which kind. Both get more valuable as models improve. A stronger model makes more of the same metadata, and issues more parallel queries against the same engine. I didn’t build the rest: domain-encoded operators, cross-signal special syntax, hardcoded observability “intelligence.” They are all buildable. They are also heavy, and every one of them competes with the LLM for the same work. The same principle applies outside observability: Infrastructure should expose the simplest, most stable interface upward so LLMs can use it easily, and do the deepest, least replaceable optimization downward so LLMs cannot replace it. Any “semi-intelligent” layer in between (hardcoded domain rules, preset query templates, elaborate domain DSLs) will eventually be routed around or replaced. A database’s job is to make the smart thing, the LLM, easy to use and able to use it more fully. DuckDB is an early sign of this. It took off because it’s simple enough that an LLM can generate queries against it directly. In the agent era, a database’s moat isn’t how smart it is. It’s whether agents can use it efficiently. For the past decade, databases have evolved toward getting smarter: auto-tuning, AI-driven optimization, increasingly elaborate built-in intelligence. But in the agent era, “smart” has been partly taken over by the LLM. A database still competing with the LLM on that axis is putting its weakness against someone else’s strength. The right move is repositioning: do what the LLM can’t (deep physical optimization, the engineering of high concurrency), and make the interface effortless for it. The three pillars weren’t planned by anyone; they grew one at a time as needs appeared. Unification was thought through eight years ago, by people smart enough to see it, and nobody quite delivered it. Three waves of technology in sequence pushed it to the moment where it can be built and has to be. Facing that problem, GreptimeDB’s answer is deliberately small: a light semantic layer and a strong concurrent engine. I’d rather it be a letter opener, with clear boundaries and sharp for its purpose, than a Swiss army knife with many functions and none of them good enough. Because this time, the smartest part of the stack shouldn’t be the database. Trace Data Modeling | GreptimeDB Documentation; for physical design and the 16-region partitioning detail, see How GreptimeDB Handles Massive Trace Data at Low Cost. ↩ ClickHouse cut Langfuse’s read-path latency from minutes to near-instant; see How Langfuse is scaling LLM observability for the agentic era with ClickHouse. ↩ “Too many parts” is the most common ClickHouse write incident in production, with large batches or server-side async insert as the official remedy; see Asynchronous inserts | ClickHouse Docs. ↩ The experimental TimeSeries table engine (introduced in 24.8), PromQL translation, and its limitations: The evolution of SQL-based observability and prometheusQuery | ClickHouse Docs; “there are dragons here” is from the PromQL early preview in Open House 2026 Day 1. ↩ SharedMergeTree is available only in ClickHouse Cloud; self-hosted deployments use ReplicatedMergeTree. See SharedMergeTree | ClickHouse Cloud Docs. For a community survey of compute-storage separation in open-source ClickHouse, see ClickHouse compute-storage separation literature review (2026-01); related proposals such as Shopify’s local-primary SSD with object-storage mirror #107269 (2026-06) remain under discussion. ↩ Langfuse’s S3 + Redis queue + async worker ingestion architecture: Langfuse Architecture and From Zero to Scale: Langfuse’s Infrastructure Evolution. ↩ Openfuse, an alpha hard fork of Langfuse v3.184.1. The migration retro is in I Burned 23 Billion Tokens to “Rewrite” Langfuse. ↩ For the full semantic vocabulary, auto-stamping paths, and 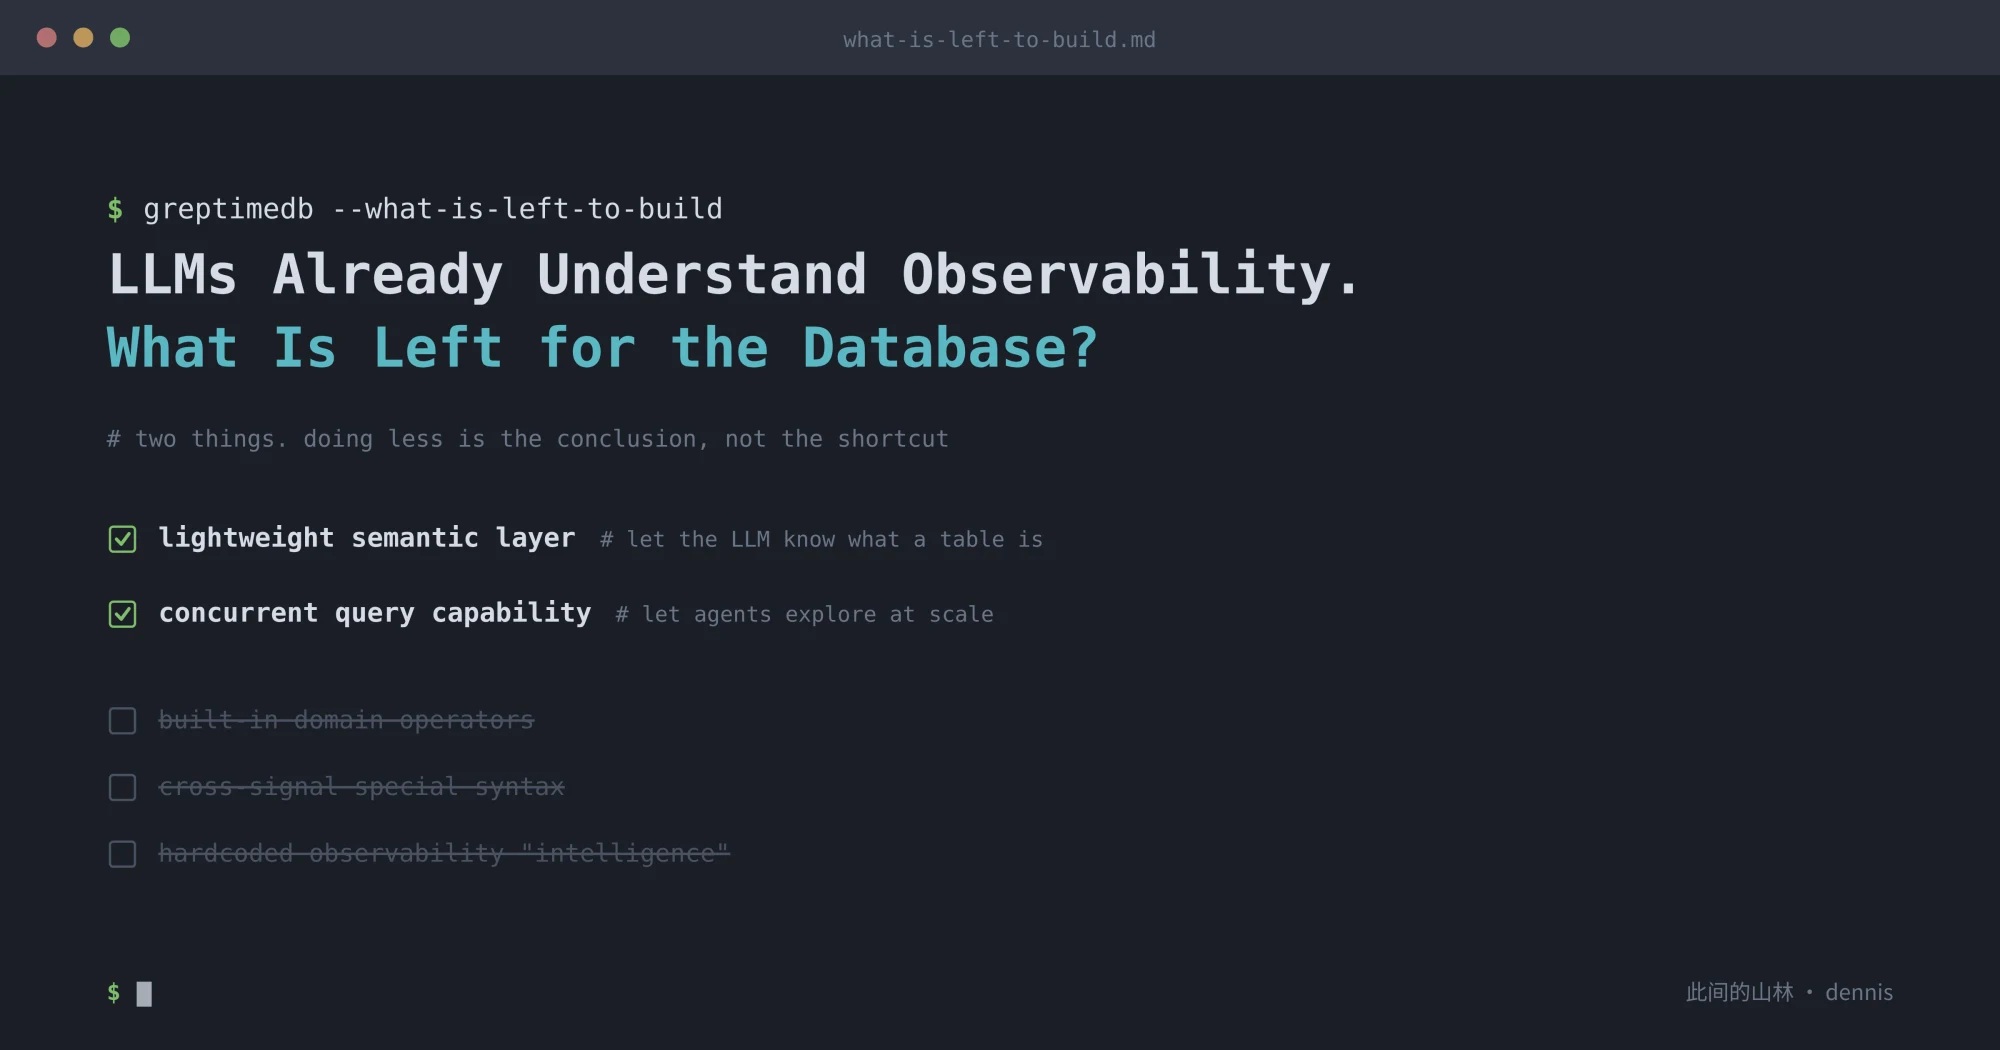
Two wrong paths I went down
opentelemetry_traces, partitioned by trace_id into 16 regions by default; service_name is pulled out as a Tag in the primary key; a duration_nano column is precomputed at write time from end_time - start_time; attributes are flattened into individual columns; span_events and span_links are stored as JSON; trace_id and service_name carry skipping indexes[1].trace_id, because “fetch every span in one trace” is the highest-frequency access.service_name in the primary key, because filtering by service is the entry point for nearly every query.duration_nano, because it’s a high-frequency derived field.span_events/span_links, because they’re nested and rarely queried.greptime_trace_v1 is a versioned built-in pipeline that hardens engineering know-how into the table structure. The query side stays standard SQL and PromQL, with no new query syntax invented on top.greptime_trace_v1 will be followed by v2, then metric pipelines and log pipelines. Each one is best practice distilled by a domain expert and an engine expert working together, which is precisely what an LLM cannot learn, because it’s system-specific engineering experience that doesn’t exist in public training data.So why not just use ClickHouse?
Thing one: a lightweight semantic layer
CREATE TABLE my_metrics (
  ts TIMESTAMP TIME INDEX,
  val DOUBLE
) WITH (
  'greptime.semantic.signal_type' = 'metric',
  'greptime.semantic.source' = 'custom',
  'greptime.semantic.metric.type' = 'counter',
  'greptime.semantic.metric.unit' = 'By'
);
greptime.semantic.metric.metadata_quality, which records how the metric type was obtained: declared when the protocol stated it, inferred when it was guessed from a suffix like _total. That field sits on the “align, don’t teach” line. The database doesn’t decide for the LLM whether rate() is appropriate; it states how much this piece of metadata can be trusted, and leaves the reasoning to the model.information_schema.table_semantics. On first connect, an agent queries one view and learns what data is here, what signal each table holds, which protocol it came from, and how trustworthy the metadata is, without scanning every table or guessing from column names. GreptimeDB’s MCP server reads this view._total suffix), anything constant, and anything that merely restates a column are all excluded on purpose. That restraint is part of the design.Thing two: very strong concurrent query capability
How the two divide the work
Thing one: semantic layer Thing two: concurrent query What it gives the LLM Knowing how to query (reasoning) Being able to query, fast (execution) Type of value Metadata alignment Engineering capability Light or heavy Extremely light Extremely heavy Where the moat is now
The series
References
information_schema.table_semantics, see Table Semantic Layer (Experimental) | GreptimeDB Documentation; for the design and progress of cross-signal entities and relationships, see Tracking: Entity relationships and graph query #8609. ↩